Grafana timelines
Posted on mer. 05 février 2025 in devops
I’ve been using Grafana for a long while now. At first for work, then I setup a instance for myself and my projects, and I took what I learned there back to work. It went back and forth this way for the best part of the last 5 years I’d say. During that time I played extensively with 4 type of graphs, Time series, Pie Chart, Histogram and I do use some Gauge now and then, and every time I need a bar chart, I just tinker a bit with the Time series.
Until now, I never used any State timeline and I thought it was just time to make it happen. Sadly it wasn’t as easy or direct as it has been with other type of graphs and I fought a bit to make it work. I’m writing this mainly I couldn’t find much information online, and this kind of article would have been a great help to me.
I’ll begin with a bit of context, some example on exporting that data, and a short illustration on what I’m using right now.
Context
As mentionned above, for the past few years I’ve been messing around with grafana and Prometheus for work and personnal projects. As time went on, it became somewhat of a reflex to add some metrics to every program I write and I intend to work in the background. The logic being that, once it’s up and running, I setup some kind of alterting and forget about it. Best case scenario, I’ll never have to read any log and if something breaks, I’ll just have a glance at some improvised dashboard, save said dashboard somewhere and look at it in the event of the next issue.
You could say (I do) that there is two kinds of status metrics (that you’ll want to check through State timelines).
Program running statuses
With that in mind, I try my best to add some very uniformised kind of reporting to all my daemon, like an heartbeat monitor that I would trust Prometheus to check now and then. This heartbeat would just serve a “I’m alive” kind of metric and the scraper would be set to fire an alert if the metric is absent.
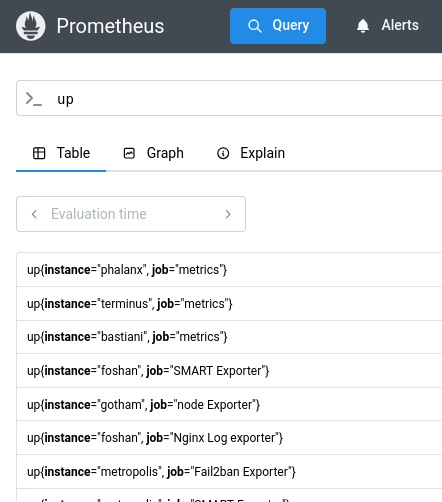
Prometheus actually serves this kind of metrics by default. Indeed, for every configured scrapes in Prometheus configuration, there is a up metrics with the name of the scrape and the crawled address. For every pair of job and scrape, you’ll have a up record with instance=<machine> and address=<scraped addr> valued at 1.0, if you don’t, the scrap failed.
I use this very built-in metric to set up alerts on wether a machine of my is down (by grouping by instance) or to have some tracking on wether or not a particular probe is down (say, for some reason, the dovecot exporter isn’t working anymore).
You can, of course, go deeper than just a dead or alive kind of check and actually check that the program you wrote is running correctly and not stuck in some ind of zombie state by checking that some metric is always increasing or something in that flavor. But that’s another story.
Tracking phases
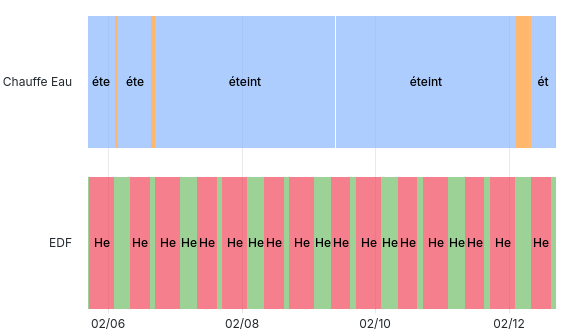
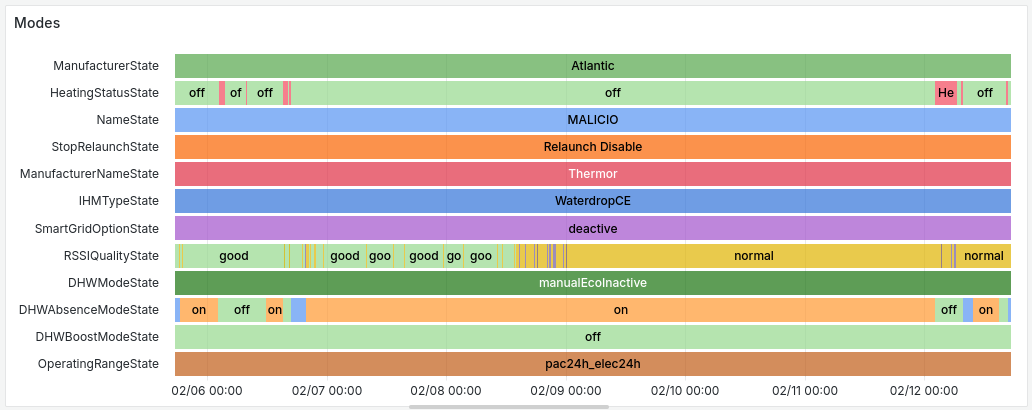
Another type of metrics is what I would refer to as “phases”. For example my water heater has various states; it may be off, Heating or above its temperature threshold. Since it’s not a binary state, it becomes awkward to represent it as there or absent as Prometheus does with the up metric.
I make this distinction only to introduce the two ways I have to setup monitoring.
Exporting
The most simple kind of export to setup is through Gauge. The basic thinking being, setup the gauge to one for all the label values you want to mean as on. You’ll have to either clear the past values (through a METRIC.clear() or through a METRIC.labels(label=label).remove()) by yourself.
For example:
# HELP my_status
# TYPE my_status gauge
my_status{status="ok"} 1.0
my_status{status="nok"} 0.0
And something like that when all is not that well :
# HELP my_status
# TYPE my_status gauge
my_status{status="ok"} 0.0
my_status{status="nok"} 1.0
The easiest way to get something like that, in python, would be :
from prometheus_client import Gauge, start_http_server

MY_STATUS = Gauge("my_status", "", ["status"])


def main():
    while True:
        try:
            # do stuf
            MY_STATUS.labels(status="ok").set(1)
            MY_STATUS.labels(status="nok").set(0)
        except Exception:
            MY_STATUS.labels(status="ok").set(0)
            MY_STATUS.labels(status="nok").set(1)


if __name__ == "__main__":
    start_http_server(9100)
    main()
This approach is very useful when it comes to tracking phases.
Here’s a more more aggressiv approch of cleaning data between update.
MY_STATUS = Gauge("my_status", "", ["key", "value"])


def main():
    while True:
        MY_STATUS.clear()
        for key, value in get_key_value_pairs().items():
            MY_STATUS.labels(key=key, value=value).set(1)
Info
Recently I discovered the Info metric in the prometheus_client python library, which have the advantage of clearing any other set of values from itself, making the output shorter and the code clearer.
The above code then becomes:
from prometheus_client import Info, start_http_server

MY_STATUS = Info("my_status", "", ["status"])


def main():
    while True:
        try:
            # do stuf
            MY_STATUS.info(status="ok")
        except Exception:
            MY_STATUS.info(status="nok")


if __name__ == "__main__":
    start_http_server(9100)
    main()
And the outputs would change from either my_status{status="ok"} 1.0 or my_status{status="nok"} 1.0 without the remaining zero values.
Caveats
On the exporting sides, the two approachs have various advantages.
The Info approach is way cleaner and easy to implement, but is actually kinda tricky. You either cram every label you wanna export into one info metric or you create many ones. Since the Info metric cleans itself automatically, it also means you have to update your info metric at once, thus updating every metrics.
The Gauge approach is way more flexible, since you can change all the values you like whenever you want. But it then falls onto you to clean the previous values, otherwise they will remain up and you’ll end up with a Gauge having several states.
To the graphs !
So I got about expressing those data in graph through a bit of headscratching.
Before going into it, please note that I’m working with 11.5.0 version of grafana and have not tested my setup with anything before or after that.
I’ll go into the details in order. Since grafana offers a search option to find the options you want to tinker with, I’ll put the exact name (at the time of writing) of that option between quote mark.
I’ll also be covering the two adjacent cases of Gauge and Info.
- In the drop down on the right, you want to select the proper type of graph, here State timeline.
- As long as you are in the options, you will want your “Color Scheme” not to be a variation on a single color, otherwise your graphic won’t be very readable (I personnaly recommend the classic palette)
- You may want to adjust the colors in “value mapping” later on by setting up the exact value that are to come up on the graph, and select the color they should be displayed on.
-
To properly setup the graph now:
- Setup the format to Table (unfold the bottom row)
- Select your
Metric - First fork in the road:
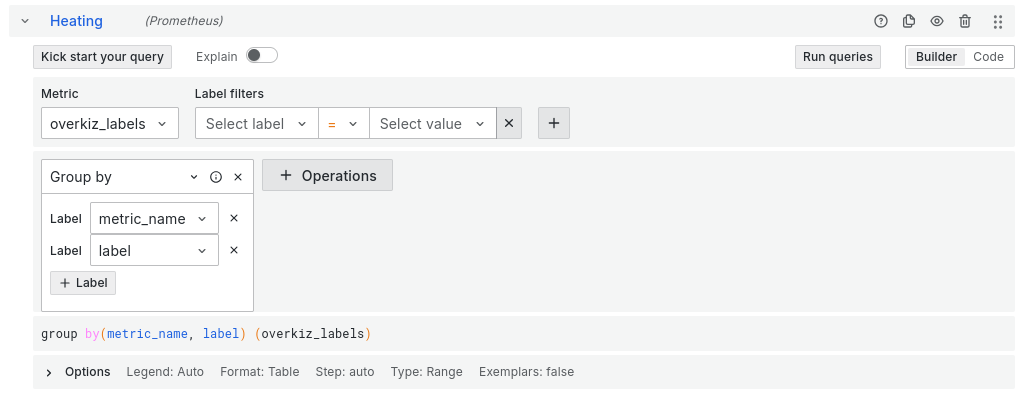
Info: since you have the only one metric, nothing is neededGauge: here you need to select the labels you’ll want to have in your graph. Add aGroup byoperation to do to.
-
The tricky part, the data will actually be gibberish so far, so you’ll need to add some transformations (in my grafana version you may do that by selecting, above the query building / listing part, the Transformations tab):
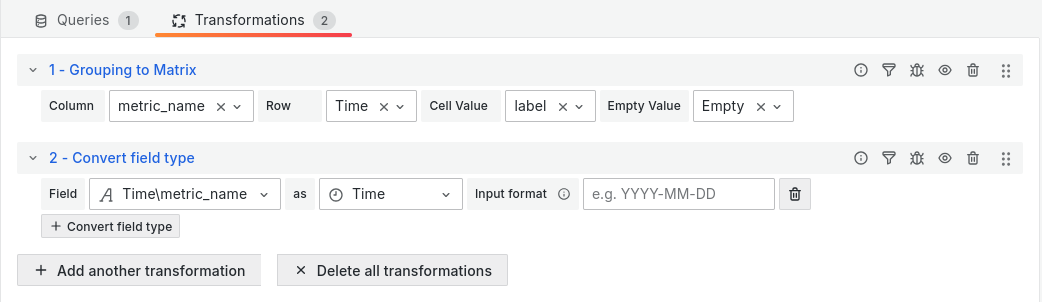
Gauge: You’ll need to add two transformations:Grouping to Matrix:- Column: the metric that you’ll want to see on the side of your graph
- Row: Time
- Cell Value: the metric you’ll want to see on the timeline bands
Convert field type: For some reason, the transformation above mess up the format of the Row and you’ll need to convert the content back to Time for the graph to work.
Info: Here you’ll only need to addFilter fields by name: You’ll make here the selection that you’d do withGaugeon the metric building setp (4).
And here you go !